The Cloudflare November 18, 2025 Outage: A Deep Dive into Causes, Mechanisms, and Lessons Learned
An exhaustive technical analysis of the Cloudflare November 18, 2025 outage, examining the root causes in ClickHouse database configuration, Bot Management system failures, propagation mechanisms across global PoPs, and comprehensive lessons for resilient distributed systems.

Introduction
Cloudflare has established itself as a cornerstone of the modern internet infrastructure, serving as the invisible backbone that powers and protects a significant portion of web traffic globally. The company’s comprehensive suite of services includes Content Delivery Network (CDN) capabilities, sophisticated Distributed Denial of Service (DDoS) protection, authoritative Domain Name System (DNS) resolution, Zero Trust security frameworks, and cutting-edge edge computing through Cloudflare Workers. With approximately 20% of all web traffic flowing through its global network of data centers, Cloudflare’s infrastructure has become an essential utility for maintaining the performance, security, and reliability of modern web applications.
On November 18, 2025, at approximately 11:20 UTC, Cloudflare experienced a significant service disruption that reverberated across the global internet ecosystem. The outage affected numerous high-profile platforms and services, including X (formerly Twitter), ChatGPT, Spotify, Canva, and thousands of other websites and applications that depend on Cloudflare’s infrastructure. Users attempting to access these services encountered HTTP 5xx error pages, effectively rendering them inaccessible. The incident persisted for nearly six hours, with full service restoration not achieved until 17:06 UTC.
The outage’s impact extended far beyond mere inconvenience. E-commerce platforms lost revenue during critical business hours, financial services faced transaction disruptions, media streaming services suffered subscriber dissatisfaction, and critical infrastructure components that rely on Cloudflare’s security and performance capabilities experienced degraded functionality. The incident served as a stark reminder of how centralized certain internet infrastructure components have become, and the cascading effects that occur when such critical systems fail.
This article provides an exhaustive technical analysis of the November 18, 2025 Cloudflare outage, dissecting the root causes at the database and application layers, examining the failure propagation mechanisms across Cloudflare’s globally distributed architecture, analyzing the response and mitigation strategies employed, and extracting actionable insights for building more resilient distributed systems. We will move beyond surface-level observations to explore the fundamental technical decisions, architectural trade-offs, and system interactions that contributed to this significant disruption.
Background on Cloudflare’s Architecture
To understand the mechanisms of the November 18 outage, we must first comprehend the intricate architecture that underpins Cloudflare’s global network. This architecture represents one of the most sophisticated distributed systems in production today, designed to handle massive scale while maintaining low latency and high availability.
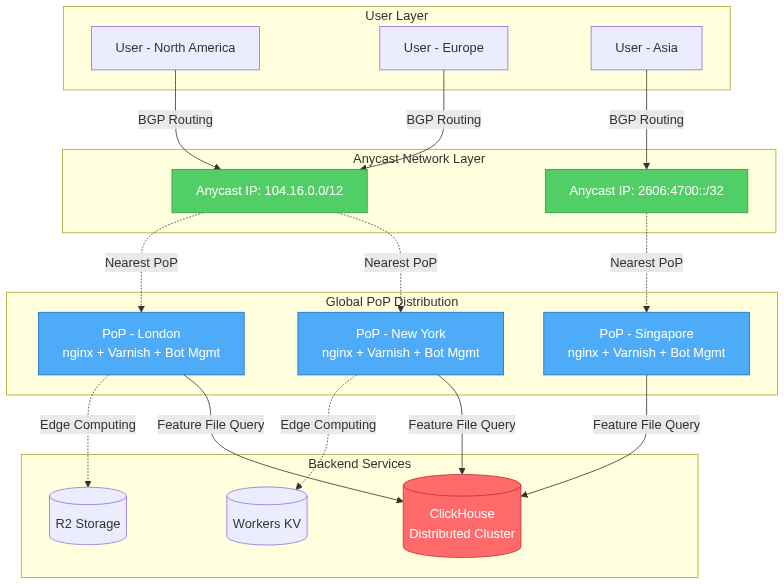
Global Network Topology and Anycast Routing
Cloudflare’s network architecture is fundamentally built on Anycast routing, a networking technique that allows multiple servers in different geographic locations to share the same IP address. When a user makes a request to a Cloudflare-protected service, the request is routed to the nearest Point of Presence (PoP) based on BGP (Border Gateway Protocol) routing metrics. This approach provides several critical advantages: reduced latency through geographic proximity, automatic failover capabilities, and inherent DDoS mitigation through traffic distribution.
The company operates over 310 data centers distributed across more than 120 countries, forming a truly global edge network. Each PoP functions as a fully autonomous unit capable of serving requests, making security decisions, and executing edge computing workloads without requiring communication with centralized control planes for routine operations. This distributed autonomy is both a strength and a potential vulnerability, as we will see in the analysis of the November 18 incident.
Core Infrastructure Components
Each Cloudflare PoP operates a sophisticated stack of components that work in concert to deliver services:
Nginx Reverse Proxy Layer: At the entry point, nginx serves as the initial request handler, managing TLS/SSL termination, connection pooling, and request routing. Cloudflare’s heavily customized nginx implementation includes extensions for handling QUIC/HTTP/3 protocols, advanced load balancing algorithms, and integration with their proprietary security systems. The nginx layer maintains connection state, handles keep-alive connections, and performs initial request validation before passing traffic to upstream services.
Varnish Caching Layer: Behind nginx, Varnish provides high-performance HTTP caching. Cloudflare’s implementation uses a distributed cache hierarchy with intelligent cache invalidation mechanisms. The cache layer stores both static content and certain dynamic responses, with TTL (Time To Live) values determined by origin server cache-control headers and Cloudflare’s proprietary caching logic. Cache hit rates typically exceed 85% for most workloads, dramatically reducing load on origin servers.
QUIC and HTTP/3 Implementation: Cloudflare was an early adopter of QUIC (Quick UDP Internet Connections) and HTTP/3 protocols. These protocols replace TCP with UDP at the transport layer, incorporating congestion control and reliability mechanisms directly into the protocol. This design eliminates head-of-line blocking issues present in HTTP/2 over TCP, reduces connection establishment latency through 0-RTT (Zero Round Trip Time) resumption, and provides better performance on mobile networks with frequent network switching.
Bot Management System: Central to our analysis is Cloudflare’s Bot Management system, which analyzes every request to generate a “bot score” indicating the likelihood that the request originates from an automated client rather than a human user. This system employs machine learning models trained on vast datasets of request patterns, browser fingerprinting techniques, behavioral analysis, and challenge-response mechanisms. The system operates inline in the request path, making real-time decisions with latency budgets measured in single-digit milliseconds.
Edge Computing Services Integration
Cloudflare Workers provides serverless computing at the edge, allowing developers to run JavaScript, WebAssembly, and other code directly within Cloudflare’s PoPs. Workers execute within V8 isolates, providing strong security boundaries with minimal overhead compared to traditional container or VM-based approaches. This architecture enables sub-millisecond startup times and efficient resource utilization, allowing a single machine to run hundreds of thousands of isolates simultaneously.
Cloudflare Pages extends this edge computing model to static site hosting with server-side rendering capabilities, while R2 provides S3-compatible object storage integrated with the edge network. These services share infrastructure with the CDN and security services, creating complex dependencies that must be carefully managed to prevent cascading failures.
Backend Data Infrastructure
Supporting the edge network are centralized and distributed data systems that provide configuration, analytics, and machine learning model updates. The ClickHouse database cluster, which played a central role in the November 18 outage, serves as one of these critical backend systems. ClickHouse is a column-oriented database management system designed for online analytical processing (OLAP), capable of generating analytical reports in real-time using SQL queries.
Cloudflare uses ClickHouse to aggregate and analyze massive volumes of request data, feeding insights into machine learning pipelines that generate feature files for the Bot Management system. The database operates in a distributed configuration with multiple nodes for redundancy and query parallelization. Data is sharded across nodes, and queries can be distributed across the cluster for parallel execution.
Potential Architectural Vulnerabilities
Despite its robust design, several architectural characteristics introduce potential vulnerabilities:
Configuration Propagation Challenges: With over 310 PoPs globally, propagating configuration changes consistently and atomically across all locations presents significant challenges. Network partitions, timing differences, and software version discrepancies can create transient inconsistent states. Traditional distributed systems consensus protocols like Paxos or Raft are often too slow for edge networks requiring sub-second configuration updates.
Tight Coupling of Services: The Bot Management system’s integration into the critical request path means that failures in this component directly impact core CDN functionality. This tight coupling eliminates isolation between services, turning localized failures into global outages.
Feature File Dependencies: The Bot Management system’s reliance on periodically updated feature files from ClickHouse creates a critical dependency chain. If the database produces malformed data, and the Bot Management software lacks robust validation, the invalid configuration can propagate globally within minutes.
Hardcoded Limits and Assumptions: Like many high-performance systems, Cloudflare’s edge software contains hardcoded limits for performance optimization. These limits, when exceeded due to unexpected conditions, can trigger panic conditions or crashes rather than degrading gracefully.
Timeline of the Outage
The November 18, 2025 outage unfolded over approximately six hours, with multiple phases of detection, investigation, attempted mitigation, and eventual resolution. Understanding this timeline provides crucial insights into both the incident’s technical nature and the operational challenges of managing distributed system failures at global scale.
Initial Failure Cascade (11:20 - 11:32 UTC)
11:20 UTC - Cloudflare’s internal monitoring systems detected anomalous failure rates in request processing across multiple PoPs. The monitoring infrastructure, built on Prometheus time-series databases with Grafana dashboards and PagerDuty alerting, registered a sudden spike in HTTP 5xx error responses. Error rates climbed from baseline levels of less than 0.01% to over 40% within minutes, triggering high-priority alerts to the on-call engineering teams.
The initial symptoms manifested as clients attempting to access Cloudflare-protected services receiving HTTP 502 (Bad Gateway) and 503 (Service Unavailable) errors. These errors indicated that Cloudflare’s edge servers were unable to successfully process requests, rather than issues with origin servers. The distributed nature of the failures, affecting multiple geographic regions simultaneously, suggested a systemic issue rather than localized infrastructure problems.
11:22 UTC - User reports began flooding social media platforms, particularly X (Twitter), with hashtags like #CloudflareDown trending globally within minutes. DownDetector, an outage monitoring service, registered thousands of problem reports across multiple services including Discord, ChatGPT, Spotify, and numerous e-commerce platforms. The breadth of affected services indicated the scope of Cloudflare’s reach in the internet ecosystem.
11:28 UTC - Cloudflare’s incident response team declared a P0 (highest priority) incident and initiated their formal incident response procedures. A dedicated incident channel was established in their internal communication systems, bringing together engineers from network operations, software development, database administration, and site reliability engineering teams. Initial investigation focused on recent deployments, network routing changes, and potential DDoS attacks, as these represent the most common causes of widespread service disruptions.
11:32 UTC - Engineering teams quickly ruled out network-layer issues through analysis of BGP routing tables, finding no anomalous route advertisements or routing loops. DDoS attack patterns were also absent from traffic analysis. Attention shifted to application-layer components, with log aggregation systems revealing common crash signatures in the Bot Management service across multiple PoPs.
Investigation and Diagnosis Phase (11:32 - 13:05 UTC)
This phase involved deep diagnostic work to identify the root cause while the outage continued to impact users globally.
11:40 UTC - Log analysis revealed that the Bot Management service was experiencing panic conditions and crashing repeatedly. Core dump analysis showed the service terminating due to an array bounds check failure when attempting to load the feature file. The service was designed to panic and restart rather than continuing with potentially corrupted data structures, a defensive programming pattern that inadvertently extended the outage duration by preventing degraded operation.
11:55 UTC - Engineers identified that the feature file used by Bot Management had increased dramatically in size. Normal operations used approximately 60 features in the machine learning model, with the software having a hardcoded limit of 200 features. The current feature file contained over 400 entries, causing the bounds check to fail and triggering the panic condition.
12:10 UTC - The investigation traced the oversized feature file to the ClickHouse database cluster responsible for generating it. Database query logs revealed that recent queries were returning duplicate rows, effectively doubling the feature count. However, the root cause of these duplicates remained unclear at this stage.
12:35 UTC - Database administrators identified a permissions change made to the ClickHouse cluster earlier that day, intended to improve security by making access to underlying tables explicit. The change modified how queries were executed against the distributed database, causing queries to return results from both the “default” database and a replica database named “r0”. This duplication was not immediately apparent in testing because it only affected specific query patterns used by the Bot Management feature file generator.
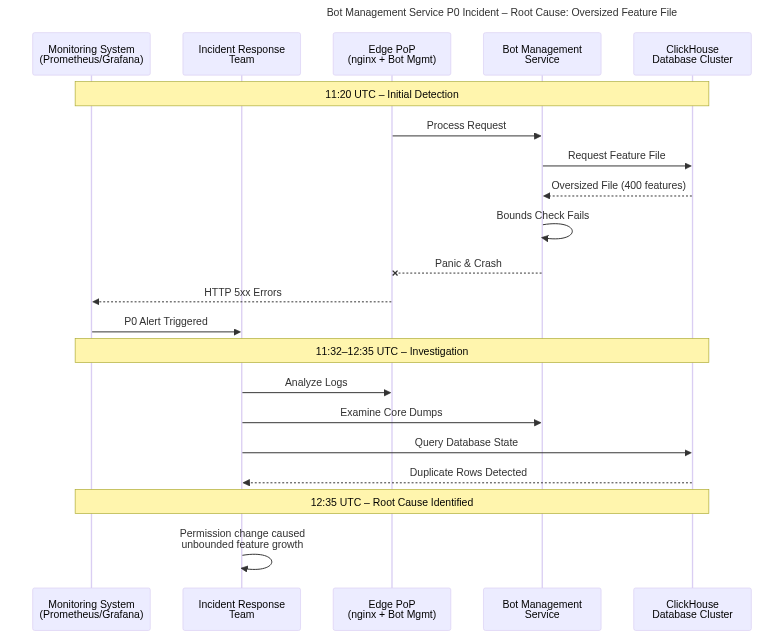
12:50 UTC - The engineering team understood the causal chain: the ClickHouse permissions change caused query result duplication, which inflated the feature file beyond the hardcoded limit in the Bot Management service, causing the service to crash on every startup attempt across all PoPs globally. The feature file generation process ran every five minutes, and depending on which ClickHouse node serviced the query, either a correct or malformed file would be generated, explaining the intermittent nature of early recovery attempts.
Mitigation Attempts (13:05 - 14:30 UTC)
With root cause identified, the team shifted focus to remediation while maintaining caution to avoid exacerbating the situation with hasty changes.
13:05 UTC - Initial mitigation efforts focused on bypassing the Bot Management system for critical services. Engineers implemented emergency configuration changes to route traffic around Bot Management for Cloudflare Access (their Zero Trust access control service) and Workers KV (their edge key-value storage). This provided partial service restoration for some customers while work continued on the underlying fix.
13:37 UTC - The team decided to rollback the Bot Management configuration to a known-good version from before the incident. This approach involved identifying the last stable feature file version from version control, validating its integrity, and preparing for global deployment. However, the automated configuration deployment system had dependencies on the very services that were failing, complicating the rollback process.
13:55 UTC - Engineers developed a manual deployment procedure to bypass the automated systems, directly copying the known-good feature file to a subset of PoPs for testing. This cautious approach ensured that the rollback itself wouldn’t introduce new issues or fail to address the root cause.
14:10 UTC - Testing on the isolated PoPs confirmed that the rolled-back configuration restored normal Bot Management operation. Error rates in test PoPs dropped to baseline levels, and request processing resumed normal patterns. This validation provided confidence to proceed with global deployment.
14:24 UTC - The team halted the automated feature file generation process to prevent new malformed files from being created while the rollback deployed. The ClickHouse permissions change was reverted, and database administrators validated that subsequent query results no longer contained duplicates. A successful end-to-end test confirmed the entire pipeline was functioning correctly.
14:30 UTC - The known-good configuration file began global deployment across all PoPs. The deployment followed Cloudflare’s standard staged rollout procedures, initially targeting PoPs in less critical regions to validate the fix before deploying to high-traffic locations. As each PoP received the corrected configuration, Bot Management services restarted successfully, and request processing resumed.
Recovery Phase (14:30 - 17:06 UTC)
14:45 UTC - Approximately 60% of Cloudflare’s PoPs had successfully received the corrected configuration and resumed normal operations. User reports of issues began declining on social media and DownDetector. However, some PoPs experienced delayed recovery due to network congestion and the priority given to ensuring deployment consistency over speed.
15:30 UTC - Recovery reached 90% completion. The remaining PoPs faced various challenges including persistent cached configurations, network connectivity issues delaying configuration delivery, and in a few cases, underlying infrastructure problems exposed by the incident that required separate attention.
16:20 UTC - Engineering teams began intensive log analysis and data collection for post-incident analysis while monitoring the final PoPs returning to service. Automated systems for anomaly detection and alerting were temporarily enhanced with additional rules to quickly identify any regression or related issues.
17:06 UTC - Cloudflare declared full service restoration, with all PoPs operational and error rates returned to baseline levels. The incident was transitioned from active mitigation to post-mortem analysis phase. Total outage duration: 5 hours and 46 minutes.
Precursors and Contributing Factors
Several factors contributed to the incident’s severity and duration:
Recent Permission Changes: The ClickHouse database permissions modification, while well-intentioned for security improvements, was deployed without comprehensive testing of all query patterns used by downstream systems. The change occurred approximately 8 hours before the outage, but the Bot Management feature file generation’s 5-minute cycle meant that multiple iterations occurred before a malformed file was produced and propagated.
Testing Gaps: The permissions change underwent standard testing procedures, but these tests did not exercise the specific query patterns used by the Bot Management feature file generator. This gap in test coverage allowed the issue to reach production undetected.
Lack of Input Validation: The Bot Management service implicitly trusted the feature file content, performing only basic format validation and bounds checking. More comprehensive validation, including feature count verification with warning levels before panic thresholds, could have detected the issue earlier and potentially allowed degraded operation instead of complete failure.
Technical Root Cause Analysis
The November 18 outage resulted from a complex interaction between database configuration, software design assumptions, and distributed system propagation mechanics. This section provides an exhaustive analysis of the technical mechanisms at each layer of the stack.
Database Layer: ClickHouse Permission Configuration Error
At the foundation of the incident was a seemingly innocuous change to ClickHouse database permissions. To understand the impact, we must first examine ClickHouse’s distributed architecture and query execution model.
ClickHouse operates as a distributed database with multiple nodes, using a “default” database for primary operations and replica databases (like “r0”) for redundancy and query parallelization. Prior to the change, the system’s permission model allowed implicit access to underlying tables, meaning that queries could execute without explicitly specifying the database name.
The security enhancement modified this behavior to require explicit database specification in queries. However, the feature file generation query was not updated to reflect this change. The consequence was that ClickHouse’s query planner, attempting to satisfy the query, executed it against both the default database and the r0 replica database, returning a union of results from both sources.
Here’s a simplified representation of the problematic query behavior:
1
2
3
4
5
6
7
8
9
10
11
12
13
14
15
16
-- Original Query (Implicit Database Access)
SELECT feature_id, feature_name, feature_weight
FROM bot_features
WHERE active = 1
ORDER BY feature_priority;

-- Post-Permission Change Execution
-- ClickHouse interprets this as:
SELECT feature_id, feature_name, feature_weight
FROM default.bot_features
WHERE active = 1
UNION ALL
SELECT feature_id, feature_name, feature_weight
FROM r0.bot_features
WHERE active = 1
ORDER BY feature_priority;
The UNION ALL semantic (as opposed to UNION with deduplication) meant that every feature appeared twice in the result set. Since both databases contained identical data, the query returned perfectly valid-looking results—just duplicated. This duplication was not immediately obvious because the query structure and result format remained syntactically correct.
The feature file generation process extracted these results and serialized them into a binary format optimized for rapid loading by the Bot Management service. The file format specification included a feature count field, which now accurately reflected the doubled count, but exceeded the downstream service’s expectations.
Application Layer: Bot Management Service Failure Mode
The Bot Management service architecture provides context for understanding why the oversized feature file triggered complete service failure rather than degraded operation.
The service is implemented in Go, taking advantage of the language’s performance characteristics and concurrency primitives. At startup, the service loads the feature file into memory, deserializing it into data structures optimized for rapid feature lookup during request processing. The deserialization code includes a critical bounds check:
1
2
3
4
5
6
7
8
9
10
11
12
13
14
15
16
17
18
19
20
21
const maxFeatureCount = 200

type FeatureLoader struct {
    features []Feature
}

func (fl *FeatureLoader) LoadFeatures(filepath string) error {
    data, err := os.ReadFile(filepath)
    if err != nil {
        return fmt.Errorf("failed to read feature file: %w", err)
    }

    header := parseHeader(data)
    if header.FeatureCount > maxFeatureCount {
        // Panic condition: feature count exceeds hardcoded limit
        panic(fmt.Sprintf("feature count %d exceeds maximum %d",
            header.FeatureCount, maxFeatureCount))
    }

    // Continue with deserialization...
}
The maxFeatureCount constant was set to 200 based on expected maximum feature set size with significant headroom (normal operation used ~60 features). This defensive programming pattern, using a panic rather than returning an error, reflected assumptions about feature file validity: if the count exceeded this generous limit, the file was presumed corrupted, and continuing with potentially malformed data could lead to incorrect bot scores, security bypasses, or memory corruption.
The panic triggered Go’s runtime error handling, which by default terminates the process. Cloudflare’s edge infrastructure includes process supervision using systemd, which automatically restarts failed services. However, since the malformed feature file persisted and was reloaded on each restart attempt, the service entered a crash loop, restarting every few seconds but never achieving stable operation.
This design choice—failing completely rather than degrading gracefully—represents a common trade-off in security-critical systems. The Bot Management service’s role in distinguishing legitimate traffic from automated attacks means that operating with incorrect data could be worse than not operating at all, potentially allowing malicious traffic through or incorrectly blocking legitimate users.
However, the lack of graduated failure modes proved problematic. Alternative designs could have included:
Warning Thresholds: Issue alerts when feature count exceeds expected ranges (e.g., >100 features) without failing, escalating to panic only at extreme values (e.g., >500 features).
Fallback Modes: Maintain a cached copy of the last known-good feature file, allowing operation with stale data rather than complete failure.
Graceful Degradation: Operate with a reduced feature set, using only the first N features rather than failing entirely, potentially with reduced accuracy but maintaining availability.
Configuration Propagation Mechanism
The feature file generation and distribution system operated on a five-minute cycle, continuously updating Bot Management configurations across all PoPs. This system provides near-real-time updates for threat model improvements but also acts as a vector for rapid failure propagation.
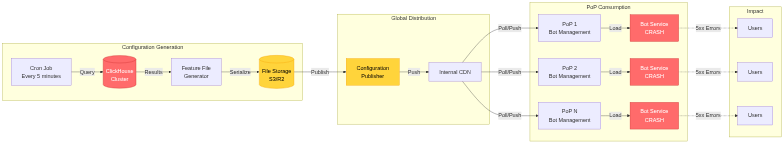
The distribution mechanism exhibits eventual consistency characteristics. When a new feature file is generated, it’s published to Cloudflare’s internal content distribution system, from which PoPs pull updates. Network latency, PoP polling intervals, and caching behavior mean that different PoPs receive updates at different times, creating transient inconsistency windows.
During the incident, this eventual consistency model created confusing symptoms. Depending on which ClickHouse node serviced the feature file generation query, either a correct file (from nodes that didn’t exhibit the duplication issue) or malformed file (from nodes affected by the permission change) would be generated. This created a pattern of intermittent failures that gradually evolved into consistent failure as the database state converged across all nodes.
Layer-by-Layer Breakdown
Layer 3 (Network Layer): At the network layer, the Anycast routing mechanism functioned correctly throughout the incident. BGP routing tables remained stable, and traffic continued to flow to appropriate PoPs based on geographic proximity and routing metrics. The network layer provided no indication of issues, as the problem existed entirely above Layer 3.
Layer 4 (Transport Layer): TCP connection establishment and maintenance proceeded normally. Clients successfully established connections to Cloudflare edge servers, completed TLS handshakes, and transmitted HTTP requests. The transport layer maintained connection state correctly, with no abnormal connection resets or timeout patterns beyond those caused by application-layer failures.
Layer 7 (Application Layer): The application layer bore the full impact of the incident. The request processing flow in normal operations follows this path:
- nginx receives HTTP request
- nginx invokes Bot Management service for bot score
- Bot Management analyzes request and returns score
- nginx applies rules based on bot score
- Request proceeds to cache layer or origin
During the outage, step 3 failed catastrophically. The Bot Management service, crashed due to the malformed feature file, could not provide bot scores. Cloudflare’s nginx configuration treated Bot Management service unavailability as a critical error, returning HTTP 503 errors rather than bypassing the bot check. This design decision reflects the security-critical nature of bot detection: allowing potentially malicious traffic through due to scoring system failures could be more harmful than temporary service unavailability.
Mathematical Analysis of Failure Propagation
The outage’s global impact can be modeled mathematically based on the configuration propagation characteristics:
Let:
N= total number of PoPs (≈310)t_gen= feature file generation interval (5 minutes)P_bad= probability that feature file generation produces malformed filet_prop= average propagation time to reach all PoPs (2-3 minutes)t_restart= Bot Management service restart time (15-20 seconds)
Initially, P_bad was less than 1.0 due to inconsistent ClickHouse node behavior. However, as database state converged, P_bad approached 1.0, meaning every generation cycle produced a malformed file. At this point:
1
2
3
Time to global failure = t_gen + t_prop + t_restart
                       ≈ 5 + 2.5 + 0.3 minutes
                       ≈ 7.8 minutes
This matches observed behavior: the incident began suddenly but took several minutes to reach full global scope. The intermittent recovery patterns reported early in the incident correspond to periods where P_bad < 1.0, with some PoPs receiving valid files while others received malformed ones.
The expected percentage of affected requests can be modeled as:
1
2
3
4
Affected_requests(t) = N_affected(t) / N × 100%

Where N_affected(t) grows exponentially:
N_affected(t) = N × (1 - e^(-t/t_prop))
This exponential curve explains the rapid escalation from initial detection to widespread impact within approximately 10 minutes.
Comparative Analysis with Historical Incidents
Cloudflare has experienced several notable outages in recent years, providing valuable context for understanding recurring patterns and architectural challenges:
June 2022 Outage - Caused by a change to Cloudflare’s Tiered Cache architecture that inadvertently increased load on origin-facing infrastructure. The incident shared similarities with November 2025: a configuration change triggering cascading failures, and tight coupling between services amplifying impact. However, the 2022 incident stemmed from capacity exhaustion rather than software crashes.
October 2024 BGP Leak Incident - While not caused directly by Cloudflare, this incident demonstrated how BGP misconfigurations from peer networks can impact Anycast-based services. The November 2025 incident differed fundamentally as the network layer remained healthy; the failure occurred entirely in application-layer services.
Recurring Patterns: Several common threads emerge across these incidents:
Configuration Changes as Trigger Events: Many major outages trace to configuration changes, despite robust testing procedures. The complexity of distributed systems means that test environments cannot perfectly replicate production conditions, particularly around scale, timing, and emergent behaviors.
Tight Service Coupling: Services integrated into the critical request path (like Bot Management) have disproportionate impact when failing. Architectural patterns that prioritize security or functionality over resilience create single points of failure.
Propagation Speed vs. Testing Speed: Modern configuration distribution systems propagate changes globally in minutes, faster than comprehensive testing can validate changes across all possible scenarios and interactions.
Impact and Ripple Effects
The November 18, 2025 outage generated wide-ranging impacts across multiple dimensions: technical, economic, and reputational. Quantifying these effects provides important context for understanding the incident’s significance and motivating investments in resilience.
Direct Technical Impact
The outage affected approximately 20% of internet traffic globally, given Cloudflare’s market share. During peak impact (roughly 11:30 - 14:30 UTC), services protected by Cloudflare experienced:
- HTTP Error Rates: Spiked from baseline <0.01% to 40-60% depending on service configuration
- Request Latency: For requests that succeeded during intermittent recovery periods, latency increased 300-500% due to retry attempts and service instability
- Cache Hit Rates: Dropped significantly as the Bot Management failures prevented proper request routing to cache layers
- Certificate Validation: Some customers reported TLS/SSL certificate validation issues as edge services struggled to maintain consistent state
DownDetector reported over 130,000 problem reports across various services during the incident peak, with the following services most prominently affected:
- Discord: >40,000 reports
- ChatGPT: >25,000 reports
- Spotify: >15,000 reports
- Canva: >12,000 reports
- Numerous smaller services: Thousands of additional reports
These numbers significantly undercount actual impact, as many users don’t report outages through monitoring services, and automated systems (APIs, mobile apps, IoT devices) fail silently from user perspective.
Economic Impact
Quantifying economic losses from internet outages involves considerable uncertainty, but several methodologies provide estimates:
E-commerce Revenue Loss: For online retailers, downtime directly translates to lost sales. Assuming average e-commerce conversion rates of 2-3% and average order values of $50-100, even modest-traffic e-commerce sites lost thousands to tens of thousands of dollars during the 5.75-hour outage. Enterprise-scale retailers likely experienced losses in the hundreds of thousands to millions of dollars.
Advertising Revenue: Services monetized through advertising (streaming platforms, content sites, social media) lost ad impressions and engagement. Using industry-standard CPM (cost per thousand impressions) rates of $5-15, and considering the vast traffic volumes these services handle, aggregate advertising revenue losses likely reached tens of millions of dollars across all affected services.
SaaS Service Credits: Many Software-as-a-Service providers offer uptime SLAs (Service Level Agreements) with financial penalties for exceeding downtime thresholds. Cloud service providers, development tools, and business applications affected by the outage may face SLA credit obligations to customers, distributing the economic impact across the ecosystem.
Productivity Losses: Beyond direct revenue impacts, organizations experienced productivity losses as employees couldn’t access cloud applications, collaboration tools, or business systems. Assuming an average of 10 million workers affected for an average of 3 hours at an average fully-loaded hourly rate of $50, productivity losses could exceed $1.5 billion globally—though this figure involves substantial estimation uncertainty.
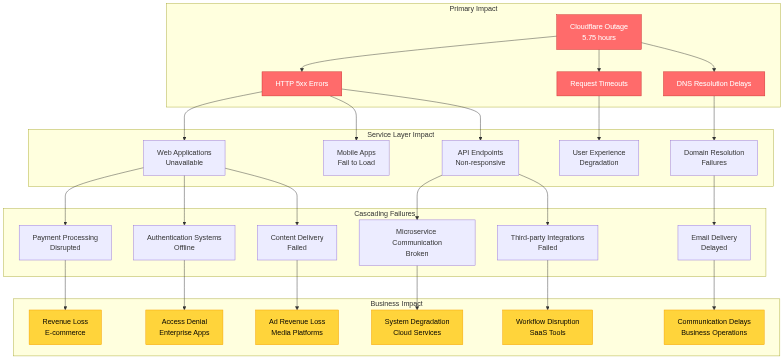
Cascading Technical Failures
Beyond the direct impact of Cloudflare services being unavailable, several cascading failures amplified the incident’s scope:
DNS Resolution Failures: Many services use Cloudflare’s 1.1.1.1 DNS resolver or Cloudflare-managed DNS for their domains. While the DNS resolver service (1.1.1.1) operated independently of the Bot Management failure, domains using Cloudflare for authoritative DNS experienced resolution issues when Cloudflare’s control plane services became unstable. This led to secondary outages as clients couldn’t resolve domain names to IP addresses, even for services not using Cloudflare’s CDN or security services.
API Integration Breakdowns: Modern applications extensively use third-party APIs for functionality ranging from payment processing to authentication to content delivery. When APIs hosted behind Cloudflare became unavailable, applications lost critical capabilities. For example:
- Payment gateways became unreachable, preventing e-commerce transactions
- OAuth identity providers failed, blocking user authentication
- Content APIs stopped responding, causing mobile apps to display errors
- Webhook delivery failed, breaking event-driven architectures
These cascading API failures created complex troubleshooting scenarios. End-users experienced application errors, but application developers initially didn’t realize the issues stemmed from Cloudflare infrastructure rather than their own code or upstream service providers.
CDN Cache Invalidation: When Cloudflare services recovered, the sudden flood of requests to origin servers as caches repopulated created secondary capacity challenges. Origin servers that normally handle only cache misses suddenly received full request volumes, causing performance degradation or secondary outages for services without adequate origin capacity headroom.
Zero Trust Security Services: Organizations using Cloudflare Access for Zero Trust network access found employees unable to reach internal applications and systems. Unlike traditional VPN-based access where outages might allow fallback to direct connections, Zero Trust architectures enforce that all access flows through the security proxy, meaning Cloudflare’s outage completely blocked access with no failover path.
Reputational and Trust Impact
Beyond quantifiable technical and economic impacts, the outage affected trust in internet infrastructure centralization:
Client Confidence: Organizations reassessed their dependency on single infrastructure providers, with many initiating architectural reviews to implement multi-CDN strategies or evaluate alternative providers. Security and reliability, previously viewed as Cloudflare strengths, came under increased scrutiny.
Regulatory Attention: Internet infrastructure concentration drew attention from regulators concerned about systemic risks. When single providers carry substantial portions of internet traffic, their outages constitute broader infrastructural vulnerabilities affecting economic activity and potentially even national security.
Market Competition: Competitors including Akamai, Fastly, AWS CloudFront, and Cloudflare alternatives benefited from renewed interest in provider diversification, potentially shifting market dynamics in the CDN and edge services space.
Lessons on Internet Resilience
The incident highlighted fundamental questions about internet architecture evolution:
Over-centralization Risks: As traffic consolidates with major providers for performance and security benefits, outages have increasingly widespread impact. The November 18 incident affected a substantial portion of the internet simultaneously, demonstrating how architectural decisions trading redundancy for efficiency create systemic vulnerabilities.
Cascading Dependency Chains: Modern applications compose functionality from numerous services and APIs, creating deep dependency chains. When foundational infrastructure like CDNs fail, cascading effects propagate through these dependency chains, often in unexpected ways that amplify impact beyond direct service relationships.
Recovery Complexity: Global distributed systems present unique recovery challenges. Even after identifying fixes, propagating corrected configurations across hundreds of data centers, validating consistent deployment, and ensuring graceful recovery under massive request loads requires sophisticated orchestration and substantial time.
Response, Mitigation, and Post-Mortem
Cloudflare’s response to the November 18 outage demonstrates both the strengths and challenges of managing incidents in globally distributed systems. This section examines the incident response process, mitigation strategies employed, and post-incident analysis conducted.
Incident Detection and Response Activation
Cloudflare’s incident detection relied on multi-layered monitoring infrastructure:
Prometheus and Grafana: Time-series metrics collected from all PoPs flow into Prometheus clusters, with Grafana dashboards providing visualization. Key metrics monitored include:
- HTTP status code distributions (2xx, 3xx, 4xx, 5xx)
- Request latency percentiles (p50, p95, p99, p99.9)
- Service health checks and component availability
- Resource utilization (CPU, memory, network bandwidth)
Anomaly detection rules trigger alerts when metrics deviate from expected patterns. The sudden spike in 5xx errors at 11:20 UTC exceeded alert thresholds within seconds, automatically creating high-priority incidents in PagerDuty.
PagerDuty Escalation: The initial alert triggered the on-call rotation, paging the primary on-call engineer. When acknowledged, secondary escalations notified team leads and managers. As the scope became apparent, PagerDuty’s incident response features facilitated coordination, creating dedicated incident channels and automatically pulling in subject matter experts from relevant teams.
Distributed Tracing: Cloudflare uses distributed tracing (likely based on OpenTelemetry or similar frameworks) to track requests across service boundaries. Trace analysis quickly revealed that requests were failing at the Bot Management service boundary, narrowing investigation scope and accelerating diagnosis.
Mitigation Strategy Evolution
The incident response progressed through several mitigation strategies as understanding evolved:
Phase 1: Service Isolation (13:05 - 13:37 UTC)
Initial mitigation focused on isolating critical services from the Bot Management failure. Engineers implemented emergency configuration changes to route traffic for specific high-value services around the failing component:
1
2
3
4
5
6
7
8
9
10
11
12
# Emergency configuration bypass
location / {
    # Skip bot management for critical services
    if ($host ~* "critical-service\.example\.com") {
        proxy_pass http://origin_backend;
        break;
    }

    # Normal flow with bot management
    bot_management_check;
    proxy_pass http://origin_backend;
}
This approach provided partial relief, restoring access to services like Cloudflare Access and Workers KV for customers, but couldn’t scale to bypass Bot Management for all traffic without unacceptable security risks (allowing automated attacks through unchecked).
Phase 2: Configuration Rollback (13:37 - 14:24 UTC)
With root cause identified, attention shifted to rolling back the problematic feature file. This involved several careful steps:
- Version Identification: Locate the last known-good feature file version from artifact repositories
- Integrity Validation: Verify the file’s integrity through checksums and signature validation
- Isolated Testing: Deploy to a small subset of PoPs isolated from production traffic
- Validation: Confirm that Bot Management services start successfully and process requests correctly
- Preparation for Rollout: Package the configuration for global deployment
The team’s caution, while extending recovery time, prevented potential issues where an incorrect rollback could have worsened the situation or introduced new failures.
Phase 3: Database Fix (14:10 - 14:24 UTC)
Parallel to configuration rollback, database administrators worked on the ClickHouse permissions issue:
1
2
3
4
5
6
7
8
9
10
11
-- Revert the problematic permission change
REVOKE ALL ON r0.* FROM bot_management_user;
GRANT SELECT ON default.bot_features TO bot_management_user;

-- Validate query behavior
SELECT feature_id, COUNT(*) as cnt
FROM (
    SELECT feature_id FROM bot_features WHERE active = 1
) GROUP BY feature_id
HAVING cnt > 1;
-- Should return no results, confirming no duplicates
Fixing the database ensured that future feature file generations would produce correct output, preventing recurrence once the immediate outage was resolved.
Phase 4: Staged Global Deployment (14:30 - 17:06 UTC)
The final mitigation phase involved carefully deploying the corrected configuration across all PoPs. Cloudflare’s deployment orchestration follows a staged approach:
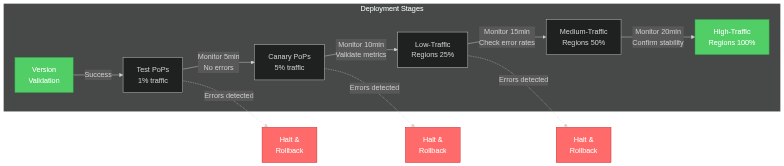
Each stage included automated health checks, error rate monitoring, and validation before proceeding to the next stage. If any stage detected elevated error rates or service degradation, the deployment would halt and automatically rollback to the previous configuration. This progressive rollout strategy prioritized safety over speed, accepting longer recovery time to minimize risk of exacerbating the outage.
Post-Mortem Analysis Process
Following the incident, Cloudflare conducted a comprehensive post-mortem analysis following industry best practices:
Root Cause Identification: The engineering team used multiple investigative techniques to establish the causal chain:
- Log Aggregation Analysis: ELK (Elasticsearch, Logstash, Kibana) stack analysis revealed crash patterns and timing correlations across services
- Distributed Tracing: Request traces showed precise failure points and propagation patterns
- Database Query Auditing: ClickHouse query logs identified the permissions change and resultant query behavior modifications
- Code Analysis: Review of Bot Management service code revealed the hardcoded limit and panic behavior
Contributing Factors Analysis: Beyond the immediate root cause, the team identified systemic factors that amplified impact:
- Insufficient test coverage for database permission changes across all downstream consumers
- Lack of feature count validation in the feature file generation pipeline
- Absence of circuit breaker patterns that could have isolated Bot Management failures
- Limited fallback mechanisms for continuing operations with stale configurations
Timeline Reconstruction: Detailed timeline assembly from multiple data sources (monitoring metrics, logs, deployment records, communication transcripts) provided a minute-by-minute account of the incident, facilitating understanding of response effectiveness and identifying opportunities for faster resolution.
Implemented Fixes and Preventive Measures
Cloudflare implemented multiple layers of fixes to prevent recurrence:
Immediate Fixes (Deployed within 48 hours):
- Enhanced Input Validation: Added comprehensive validation to the feature file generation process:
1
2
3
4
5
6
7
8
9
10
11
12
13
14
15
16
17
18
19
def validate_feature_file(features):
    """Validate feature file before distribution"""
    # Check feature count against expected ranges
    if len(features) < MIN_EXPECTED_FEATURES:
        raise ValidationError(f"Feature count {len(features)} below minimum {MIN_EXPECTED_FEATURES}")

    if len(features) > WARN_FEATURE_THRESHOLD:
        logger.warning(f"Feature count {len(features)} exceeds warning threshold")
        alert_ops_team("High feature count detected")

    if len(features) > MAX_SAFE_FEATURES:
        raise ValidationError(f"Feature count {len(features)} exceeds maximum {MAX_SAFE_FEATURES}")

    # Check for duplicate features
    feature_ids = [f.id for f in features]
    if len(feature_ids) != len(set(feature_ids)):
        raise ValidationError("Duplicate features detected")

    return True
- Graceful Degradation in Bot Management Service: Modified the service to support fallback modes:
1
2
3
4
5
6
7
8
9
10
11
12
13
14
15
16
17
18
19
20
21
22
23
24
func (fl *FeatureLoader) LoadFeaturesWithFallback(filepath string) error {
    // Try loading the new feature file
    err := fl.LoadFeatures(filepath)
    if err != nil {
        logger.Error("Failed to load new feature file", "error", err)

        // Attempt to load cached previous version
        if cachedFile := fl.GetCachedVersion(); cachedFile != nil {
            logger.Warn("Using cached feature file version", "version", cachedFile.Version)
            fl.features = cachedFile.Features
            return nil
        }

        // Last resort: operate with reduced feature set
        logger.Error("No cached version available, using minimal feature set")
        fl.features = fl.GetMinimalFeatureSet()
        metrics.RecordDegradedOperation()
        return nil
    }

    // Success - cache this version for future fallback
    fl.CacheCurrentVersion()
    return nil
}
- Database Query Validation: Added automated tests that validate all database queries return expected result counts and structures after permission changes.
Medium-term Improvements (Deployed within 2 weeks):
Circuit Breaker Implementation: Added circuit breaker patterns around Bot Management service calls, allowing nginx to serve requests without bot scoring when the service is unavailable, with appropriate security alerts and monitoring.
Canary Deployment for Configuration Changes: All configuration files now undergo canary deployment to 1% of PoPs with automated validation before global rollout.
- Enhanced Monitoring: Implemented additional metrics and alerts specifically for feature file distribution, including:
- Feature count trending and anomaly detection
- Distribution success rates across PoPs
- Bot Management service restart rates and crash signatures
- End-to-end synthetic transaction monitoring
- Shadow Validation: New feature files are validated in a shadow environment that processes production traffic samples before being deployed to production.
Long-term Architectural Improvements (Deployed within 3 months):
Service Mesh Integration: Implemented service mesh patterns with automatic failover, retry logic, and better observability of inter-service dependencies.
Configuration Versioning and Rollback: Enhanced configuration management system with atomic versioning, automated rollback capabilities, and blue-green deployment support.
Chaos Engineering Program: Established regular chaos engineering exercises to test failure modes and validate resilience mechanisms:
1
2
3
4
5
6
7
8
9
10
11
12
13
14
15
16
17
18
19
20
21
22
23
24
# Example chaos engineering scenario
class BotManagementFailureScenario(ChaosExperiment):
    def run(self):
        """Simulate Bot Management service unavailability"""
        target_pops = self.select_canary_pops(percentage=5)

        # Inject failure
        for pop in target_pops:
            pop.services.bot_management.set_failure_mode(
                mode="unavailable",
                duration=300  # 5 minutes
            )

        # Monitor system behavior
        metrics = self.monitor_metrics(
            duration=600,
            metrics=["error_rate", "latency_p99", "throughput"]
        )

        # Validate expectations
        assert metrics.error_rate < 0.1, "Error rate exceeded threshold"
        assert metrics.latency_p99 < 2000, "Latency degraded beyond acceptable"

        return ChaosExperimentResult(success=True, metrics=metrics)
- Multi-Region Database Architecture: Redesigned the ClickHouse deployment to include better isolation between development, staging, and production environments, with enhanced replication and failover capabilities.
Communication and Transparency
Cloudflare maintained transparent communication throughout the incident and post-mortem:
- Status Page Updates: Real-time updates on status.cloudflare.com with detailed impact assessments
- Customer Communications: Direct outreach to affected customers with impact details and compensation policies
- Public Post-Mortem: Published detailed technical post-mortem on the Cloudflare blog, including root causes, timeline, and corrective actions
- Incident Retrospective: Internal all-hands retrospective sharing lessons learned across engineering organization
This transparency, while exposing vulnerabilities, built trust with customers and the broader technical community by demonstrating accountability and commitment to continuous improvement.
Lessons Learned and Recommendations
The November 18, 2025 Cloudflare outage provides valuable lessons applicable to all organizations operating large-scale distributed systems. This section synthesizes key insights and actionable recommendations.
Lessons for System Architecture
1. Design for Graceful Degradation, Not Just High Availability
High availability focuses on preventing failures; graceful degradation accepts that failures will occur and designs systems to maintain partial functionality. The Bot Management service’s fail-stop behavior, while reasonable from a security perspective, eliminated the middle ground between full functionality and complete failure.
Recommendation: Implement graduated failure modes with clear trade-offs. For security-critical services, define acceptable degraded modes (e.g., stricter rate limiting, challenge-based verification) that maintain partial protection without requiring full functionality.
2. Validate Assumptions Through Continuous Testing
The hardcoded 200-feature limit was based on valid assumptions at implementation time but became a hidden constraint that could be violated by upstream changes. Such assumptions often exist throughout codebases, creating invisible coupling between components.
Recommendation: Maintain an inventory of assumptions and constraints embedded in code. Implement contract testing between services that validates interface expectations, including not just data formats but also value ranges, counts, and behavioral expectations.
3. Treat Configuration as Code with Full CI/CD Rigor
The ClickHouse permissions change underwent standard testing but missed critical interaction patterns. Configuration changes often receive less scrutiny than code changes despite having equal or greater impact potential.
Recommendation: Apply full CI/CD practices to all configuration changes:
- Comprehensive unit and integration testing
- Canary deployments with automated validation
- Automated rollback on error detection
- Required review from service owners potentially affected by changes
4. Design for Observable Failure Modes
The intermittent nature of early failures, caused by inconsistent ClickHouse node behavior, created confusion during diagnosis. Observable systems make failure modes explicit and traceable.
Recommendation: Invest in observability infrastructure:
- Distributed tracing across all service boundaries
- Structured logging with correlation IDs
- Metrics with high cardinality for fine-grained analysis
- Automated anomaly detection with context-aware alerting
Lessons for Incident Response
1. Incident Response Training and Simulation
While Cloudflare’s incident response was generally effective, the 6-hour resolution time demonstrates opportunities for improvement. Regular training and simulation prepare teams for high-pressure situations.
Recommendation: Conduct quarterly incident response simulations (GameDays) covering various failure scenarios. Train team members on incident command systems, communication protocols, and decision-making under uncertainty.
2. Automated Diagnostics and Remediation
Manual diagnosis and remediation steps consumed significant time during the incident. Automated runbooks and self-healing systems can accelerate response.
Recommendation: Develop automated diagnostic playbooks that execute standard troubleshooting steps, collect relevant logs and metrics, and present structured information to responders. Implement self-healing mechanisms for common failure patterns, with human oversight for critical changes.
3. Incident Communication Templates and Automation
Clear, timely communication with stakeholders reduces secondary impacts and maintains trust. Pre-prepared templates and automated systems support consistent communication.
Recommendation: Maintain incident communication templates for various scenarios and severity levels. Implement automated status page updates triggered by monitoring thresholds. Establish clear communication cadences (e.g., updates every 30 minutes during major incidents).
Lessons for Organizational Practices
1. Cross-Team Impact Analysis for Changes
The database permissions change had insufficient analysis of downstream impacts on consuming services. Cross-team dependencies create hidden coupling that requires explicit management.
Recommendation: Implement mandatory impact analysis for infrastructure and platform changes:
- Maintain a service dependency graph
- Require downstream team review for changes affecting shared infrastructure
- Use automated tools to identify potential impacts based on dependency graphs
2. Blameless Post-Mortems with Action Item Tracking
Effective post-mortems focus on systemic improvements rather than individual blame. Action item tracking ensures improvements are actually implemented.
Recommendation: Adopt blameless post-mortem culture with structured processes:
- Focus on systemic factors and contributing conditions, not individual actions
- Generate concrete, actionable improvement items with owners and deadlines
- Track action item completion and effectiveness through subsequent review cycles
3. Investment in Resilience Engineering
Organizations often prioritize feature development over resilience engineering until major incidents occur. Proactive investment in resilience prevents costly outages.
Recommendation: Allocate dedicated engineering time (e.g., 20% of capacity) to resilience initiatives:
- Chaos engineering and fault injection testing
- Architecture reviews focused on failure modes
- Technical debt reduction, particularly around operational complexity
- Resilience pattern implementation (circuit breakers, bulkheads, rate limiters)
Lessons for the Industry
1. Infrastructure Centralization Risks
Cloudflare’s significant internet traffic share means their outages have outsized impact. This centralization creates systemic risks to internet reliability.
Recommendation for Organizations: Implement multi-provider strategies for critical infrastructure:
- Use multiple CDN providers with automatic failover
- Distribute DNS across multiple authoritative providers
- Design applications to function with degraded performance when CDN is unavailable
Recommendation for Providers: Industry collaboration on resilience standards and shared incident response practices can improve overall internet reliability.
2. Shared Responsibility Model Clarification
Many customers affected by the outage had limited visibility into the issue or ability to mitigate impact. Clear shared responsibility models help customers architect for provider failures.
Recommendation: Providers should clearly document:
- Failure modes and expected behaviors during outages
- Customer-implementable redundancy and failover strategies
- Monitoring and alerting capabilities available to customers
- SLA definitions and limitations
3. Regulatory Considerations for Critical Infrastructure
As internet infrastructure providers become increasingly critical to economic function, regulatory frameworks may evolve to mandate minimum resilience standards, incident reporting, and redundancy requirements.
Recommendation: Proactive engagement with regulatory bodies to develop practical, effective standards that improve resilience without imposing counterproductive constraints on innovation and operational flexibility.
Conclusion
The Cloudflare November 18, 2025 outage serves as a compelling case study in the complexities, vulnerabilities, and challenges inherent in operating globally distributed systems at massive scale. What began as a well-intentioned database permissions change to enhance security cascaded through multiple system layers, triggering failure modes that propagated across 310 Points of Presence and affected approximately 20% of global internet traffic for nearly six hours.
The incident illuminates several fundamental tensions in distributed systems design:
Security vs. Availability: The Bot Management service’s design prioritized security by failing completely rather than operating with potentially incorrect data. While this choice is defensible for security-critical components, it eliminated opportunities for graceful degradation that could have maintained partial service availability.
Coupling vs. Functionality: Tight integration between Bot Management and the core request path enabled sophisticated threat detection across all traffic but created a single point of failure where issues in one component affected all services.
Speed vs. Safety: Modern configuration distribution systems can propagate changes globally in minutes, enabling rapid response to threats and optimization opportunities. However, this speed also allows misconfigurations to impact the entire system before comprehensive testing and validation can occur.
Complexity vs. Observability: The sophisticated architecture enabling Cloudflare’s performance and security capabilities creates intricate interactions between components. During incidents, this complexity can obscure causal relationships and slow diagnosis, as demonstrated by the intermittent failures caused by inconsistent database node behavior.
The technical community should extract several key insights from this incident:
Assumptions Embedded in Code Become Constraints: The 200-feature hardcoded limit represented a reasonable assumption at implementation time but became a hidden constraint that could be violated by upstream changes. Regular review and validation of embedded assumptions prevents such constraints from causing failures.
Configuration Changes Require Code-Level Rigor: Database permissions changes, feature flags, and other configuration modifications can have equal or greater impact than code changes. They merit the same level of testing, review, and gradual rollout as code deployments.
Observability Enables Rapid Response: Cloudflare’s comprehensive monitoring infrastructure (Prometheus, Grafana, distributed tracing, structured logging) enabled detection within minutes and facilitated diagnosis despite the system’s complexity. Organizations operating distributed systems must invest heavily in observability.
Resilience Requires Explicit Design: High availability is necessary but insufficient. Systems must explicitly design for graceful degradation, incorporating fallback modes, circuit breakers, bulkheads, and other resilience patterns that maintain partial functionality during component failures.
Centralization Creates Systemic Risks: As internet infrastructure consolidates with major providers, individual outages have broader impact. Both providers and customers must architect for these systemic risks through redundancy, multi-provider strategies, and resilience mechanisms.
Looking forward, the incident suggests several evolving trends in infrastructure operations:
AI-Driven Operations: Machine learning models can potentially detect anomalous patterns (like unexpected feature count increases) before they trigger failures, and can accelerate diagnosis by automatically correlating symptoms across distributed systems. However, the irony that this incident affected an ML-powered system demonstrates that AI operations tools must themselves be carefully designed for resilience.
Formal Methods Adoption: The complexity of distributed systems increasingly argues for formal verification methods that can prove correctness properties and identify edge cases that manual testing misses. While traditionally too expensive for widespread use, advances in automated theorem proving and model checking may make formal methods more accessible.
Resilience as a Service: The technical sophistication required to implement comprehensive resilience patterns may drive demand for resilience-as-a-service offerings that provide circuit breakers, chaos engineering, and failover capabilities as managed services, similar to how cloud providers offer managed observability services.
Regulatory Evolution: As critical infrastructure providers like Cloudflare become essential to economic function, regulatory frameworks will likely evolve to mandate minimum resilience standards, incident transparency, and perhaps even architectural requirements like multi-region redundancy.
The November 18 outage, while disruptive and costly, ultimately strengthens the internet ecosystem by exposing vulnerabilities, driving improvements, and generating shared knowledge across the technical community. Cloudflare’s transparent post-mortem and comprehensive remediation demonstrate the value of blameless culture and continuous learning. Organizations operating distributed systems at any scale can apply these lessons to improve their own resilience, operational practices, and incident response capabilities.
As our digital infrastructure becomes increasingly central to economic activity, education, healthcare, and social interaction, the reliability and resilience of foundational services like CDNs, DNS, and cloud platforms become matters of broad public concern. The technical community bears responsibility for architecting systems that balance the benefits of centralization and optimization against the need for resilience and graceful failure handling. The November 18 incident reminds us that this balance remains challenging to achieve, and that continuous investment in resilience engineering, operational excellence, and systemic thinking is essential for maintaining the reliability of the internet infrastructure upon which modern society depends.
References
Cloudflare Official Blog Post: “18 November 2025 Outage Post-Mortem” - blog.cloudflare.com/18-november-2025-outage
DownDetector Incident Reports: Cloudflare, Discord, ChatGPT, Spotify Service Disruptions - November 18, 2025
Cloudflare Architecture Documentation: Anycast Network, Edge Computing Platform, and Bot Management System
ClickHouse Official Documentation: Distributed Query Execution and Permission Models
Industry Analysis: Internet Infrastructure Centralization Risks and Resilience Strategies
Previous Cloudflare Incident Reports: June 2022 Tiered Cache Outage, October 2024 BGP Incident
Distributed Systems Literature: “Designing Data-Intensive Applications” by Martin Kleppmann, “Site Reliability Engineering” by Google, “Release It!” by Michael Nygard