Day 64: Kernel Trace Analysis in Modern Operating Systems
Table of Contents
- Introduction
- Kernel Tracing Fundamentals
- Trace Collection Mechanisms
- Analysis Techniques
- Forensic Data Structures
- Implementation
- Trace Visualization
- Case Studies
- Further Reading
- Conclusion
1. Introduction
Operating System forensics at the kernel level involves sophisticated trace analysis techniques to understand system behavior, investigate security incidents, and debug complex system issues. This blog explains the implementation of kernel trace analysis tools and techniques for forensic investigation.
Kernel trace analysis is essential for understanding the inner workings of an operating system, identifying performance bottlenecks, and detecting malicious activities. By leveraging kernel tracing, developers and security professionals can gain deep insights into system operations and improve overall system security and performance.
2. Kernel Tracing Fundamentals
Core concepts of kernel trace analysis include:
-
Trace Points: Strategic locations in the kernel where trace data is collected. These points capture critical system events, state changes, and execution paths. The implementation includes both static and dynamic trace points, allowing for flexible data collection based on investigation needs.
-
Event Collection: Mechanisms for gathering and storing trace data efficiently. This includes ring buffers, per-CPU buffers, and compressed storage formats. The system implements both synchronous and asynchronous event collection to minimize impact on system performance.
-
Timestamp Correlation: Precise timing information for event sequencing and analysis. The implementation uses high-resolution timers and maintains global clock synchronization for accurate event ordering.
Understanding these fundamentals is crucial for building effective kernel trace analysis systems. By strategically placing trace points, efficiently collecting events, and correlating timestamps, developers can create robust forensic tools that provide valuable insights into system behavior.
3. Implementation of Trace Collection System
Here’s an example of a kernel trace collection system:
#include <linux/module.h>
#include <linux/kernel.h>
#include <linux/ftrace.h>
#include <linux/ringbuffer.h>
#include <linux/percpu.h>
#include <linux/slab.h>
#include <linux/time.h>

#define TRACE_BUFFER_SIZE (1 << 20)  // 1MB per CPU
#define MAX_EVENT_SIZE 256

struct forensic_trace {
    struct ring_buffer *buffer;
    atomic_t active_traces;
    struct mutex trace_lock;
    unsigned long flags;
};

struct trace_event {
    u64 timestamp;
    pid_t pid;
    int cpu;
    unsigned long type;
    char data[MAX_EVENT_SIZE];
};

static DEFINE_PER_CPU(struct forensic_trace, per_cpu_trace);

static void (*original_syscall_ptr)(void);
static struct ftrace_hook {
    const char *name;
    void *function;
    void *original;
    unsigned long address;
    struct ftrace_ops ops;
} syscall_hooks[] = {
    {"sys_read", trace_sys_read, NULL, 0},
    {"sys_write", trace_sys_write, NULL, 0},
    {"sys_exec", trace_sys_exec, NULL, 0},
    {NULL, NULL, NULL, 0},
};

static int init_trace_buffer(void)
{
    int cpu;
    struct forensic_trace *trace;

    for_each_possible_cpu(cpu) {
        trace = &per_cpu(per_cpu_trace, cpu);
        trace->buffer = ring_buffer_alloc(TRACE_BUFFER_SIZE, RB_FL_OVERWRITE);
        if (!trace->buffer)
            return -ENOMEM;

        mutex_init(&trace->trace_lock);
        atomic_set(&trace->active_traces, 0);
    }
    return 0;
}

static void record_trace_event(struct trace_event *event)
{
    struct forensic_trace *trace;
    struct ring_buffer_event *rb_event;
    void *data;

    trace = &get_cpu_var(per_cpu_trace);
    rb_event = ring_buffer_lock_reserve(trace->buffer, sizeof(*event));

    if (rb_event) {
        data = ring_buffer_event_data(rb_event);
        memcpy(data, event, sizeof(*event));
        ring_buffer_unlock_commit(trace->buffer, rb_event);
    }

    put_cpu_var(per_cpu_trace);
}

static void trace_sys_read(struct pt_regs *regs)
{
    struct trace_event event;

    event.timestamp = ktime_get_real_ns();
    event.pid = current->pid;
    event.cpu = smp_processor_id();
    event.type = TRACE_SYS_READ;

    snprintf(event.data, MAX_EVENT_SIZE, "fd: %ld, buf: %lx, count: %ld",
             regs->di, regs->si, regs->dx);

    record_trace_event(&event);
}
In this example, the init_trace_buffer function initializes a ring buffer for each CPU to store trace events. The record_trace_event function records events into the ring buffer, and the trace_sys_read function captures and records sys_read system calls.
4. Forensic Analysis Implementation
Forensic analysis involves examining trace data to identify patterns and anomalies. Here’s an example of a forensic analyzer:
struct forensic_analyzer {
    struct list_head events;
    struct rbtree_node *timeline;
    struct mutex analysis_lock;
    atomic_t analyzing;
};

static int analyze_trace_data(struct forensic_analyzer *analyzer,
                            struct trace_event *event)
{
    struct analysis_result *result;
    int suspicious = 0;

    result = kmalloc(sizeof(*result), GFP_KERNEL);
    if (!result)
        return -ENOMEM;

    mutex_lock(&analyzer->analysis_lock);

    switch (event->type) {
        case TRACE_SYS_READ:
            suspicious = analyze_read_pattern(event, result);
            break;
        case TRACE_SYS_WRITE:
            suspicious = analyze_write_pattern(event, result);
            break;
        case TRACE_SYS_EXEC:
            suspicious = analyze_exec_pattern(event, result);
            break;
    }

    if (suspicious) {
        add_to_timeline(analyzer->timeline, result);
        list_add_tail(&result->list, &analyzer->events);
    }

    mutex_unlock(&analyzer->analysis_lock);
    return suspicious;
}
In this example, the analyze_trace_data function analyzes trace events and identifies suspicious patterns. If a suspicious pattern is detected, the result is added to a timeline and a list of events for further investigation.
5. System Architecture
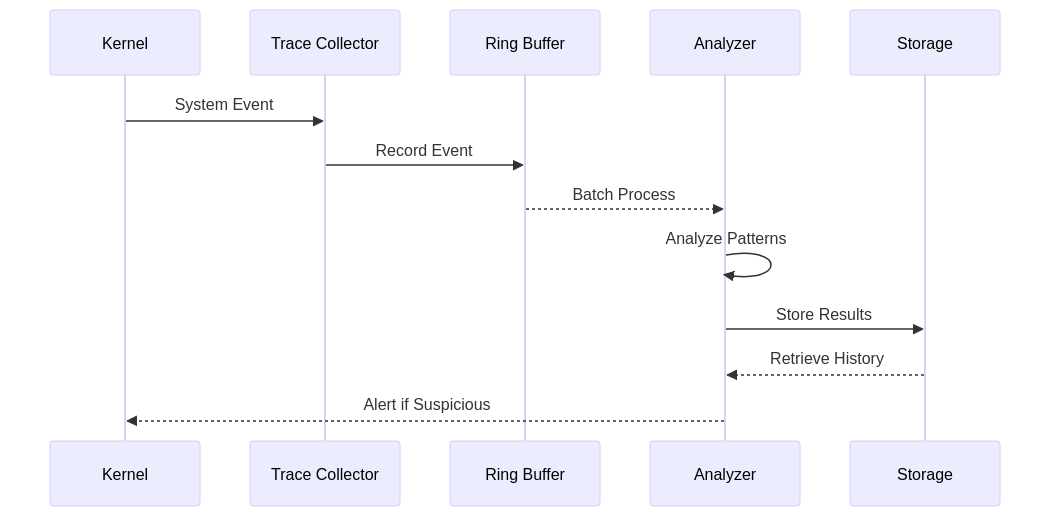
The system architecture for kernel trace analysis involves several components, including the kernel, trace collector, ring buffer, analyzer, and storage. These components work together to collect, analyze, and store trace data.
In this architecture, the kernel generates system events, which are captured by the trace collector and stored in the ring buffer. The analyzer processes the events in batches, identifies suspicious patterns, and stores the results in storage. The analyzer can also retrieve historical data for further analysis.
6. Timeline Analysis Visualization
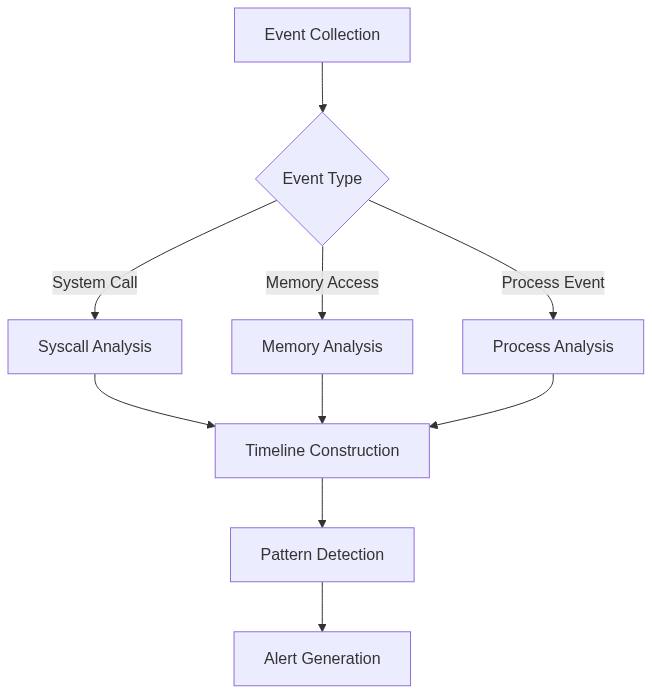
Timeline analysis involves constructing a timeline of events to identify patterns and anomalies. Here’s an example of a timeline analysis visualization:
In this visualization, events are collected and categorized by type. Each category is analyzed, and the results are used to construct a timeline. The timeline is then analyzed to detect patterns and generate alerts.
7. Performance Optimization
Performance optimization is crucial for ensuring that the trace analysis system does not negatively impact system performance. Here’s an example of a performance optimizer:
struct trace_optimizer {
    atomic_t events_processed;
    atomic_t buffer_usage;
    struct timespec64 last_flush;
    unsigned long optimization_flags;
};

static void optimize_trace_collection(struct trace_optimizer *optimizer)
{
    unsigned long flags;
    u64 current_time;

    spin_lock_irqsave(&optimizer_lock, flags);

    current_time = ktime_get_real_ns();

    if (atomic_read(&optimizer->buffer_usage) > BUFFER_THRESHOLD) {
        flush_trace_buffer();
        atomic_set(&optimizer->buffer_usage, 0);
    }

    if (atomic_read(&optimizer->events_processed) > EVENTS_THRESHOLD) {
        compress_trace_data();
        atomic_set(&optimizer->events_processed, 0);
    }

    spin_unlock_irqrestore(&optimizer_lock, flags);
}
In this example, the optimize_trace_collection function monitors buffer usage and the number of processed events. If the buffer usage exceeds a threshold, the buffer is flushed. If the number of processed events exceeds a threshold, the trace data is compressed.
8. Case Studies
-
Memory Leak Detection: Tracking system memory allocations and deallocations over time to identify potential memory leaks. The system maintains a detailed history of memory operations and analyzes patterns indicating resource leaks.
-
Privilege Escalation: Monitoring process privilege changes and suspicious system call patterns. The analysis includes tracking of process credentials, capability changes, and security context modifications.
-
File System Tampering: Detecting unauthorized modifications to critical system files. The system monitors file operations and maintains checksums of important system files.
These case studies demonstrate the practical applications of kernel trace analysis in identifying and mitigating various system issues.
9. Further Reading
- “The Art of Memory Forensics” by Michael Hale Ligh
- “Digital Forensics with Linux” by Nihad A. Hassan
- “Linux Kernel Development” by Robert Love
- “Systems Performance” by Brendan Gregg
- Academic Papers on Kernel Forensics
- Linux Trace Toolkit Documentation
These resources provide valuable insights into kernel trace analysis and can help developers build more robust forensic tools.
10. Conclusion
Kernel trace analysis is a powerful technique for system forensics, providing deep insights into system behavior and security incidents. The implementation demonstrates practical approaches to collecting and analyzing trace data while maintaining system performance.
By leveraging kernel tracing, developers and security professionals can gain a deeper understanding of system operations, identify performance bottlenecks, and detect malicious activities. The provided code examples and architectural patterns serve as a foundation for building production-grade forensic tools.

